
The Four Parts of a Pivot Table – Archive
Carl’s Content
Locating and identifying the Four Parts
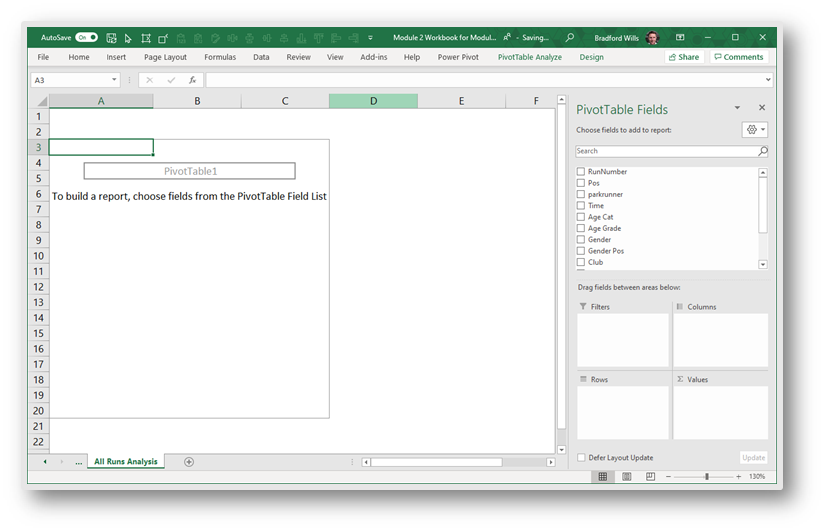
Locate and identify the four parts/block areas in the Pivot Table Fields section, towards the bottom-right of your screen; as shown in the All Runs Analysis spreadsheet example below:
The first area that we want to draw your attention to, is the Values area, as shown shaded in green in the screen-clip example below:
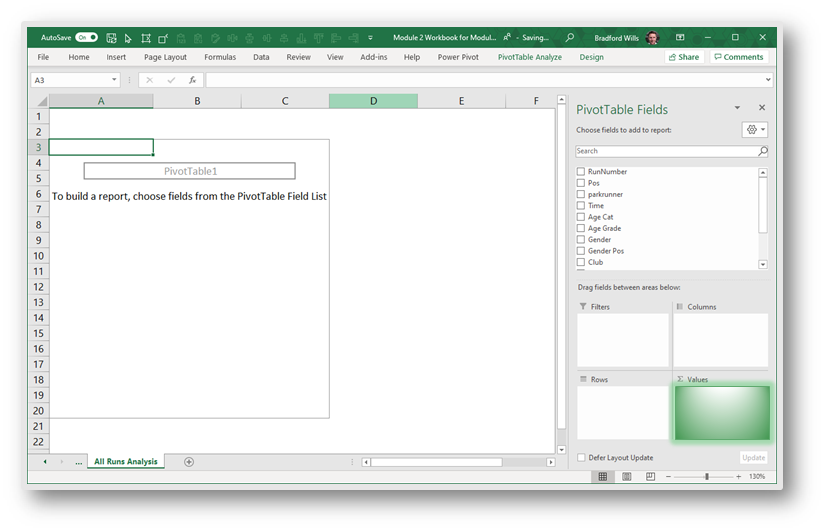
Summarise data by dragging into the Values area of the Pivot Table
Formatting the Field number format carries over to the rest of the pivot table. This allows you to format cells as follows; as shown highlighted in the screen-clip example below:

Note: Text data is summarised by “Count” by default
The Pivot Table Options drop-down menu is shown superimposed over the All Runs Analysis spreadsheet shown below:

How to change the layout of the report dynamically by moving fields around
Using the options available, it is possible to create a report showing the number of runners finishing an event, as shown in the screen-clip below:
- Select the Parkrunner field (highlighted in yellow below) by clicking on it.
- Drag the Parkrunner field into the Values area
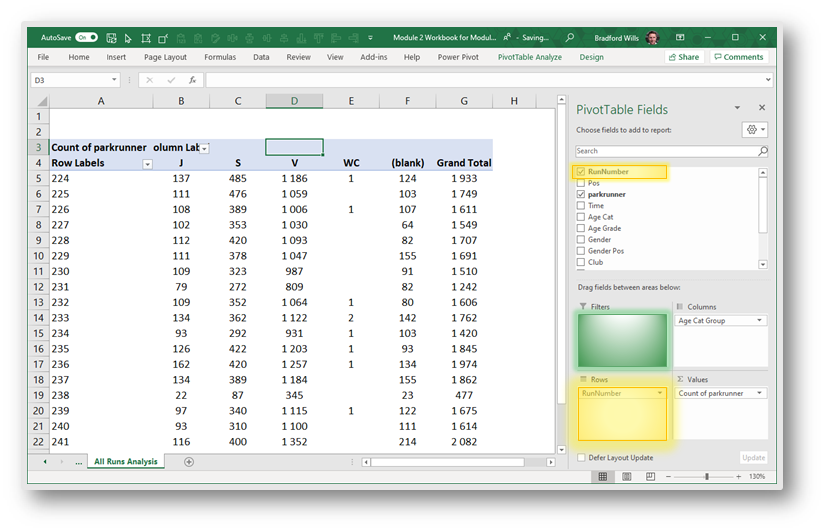
How the “Filter” Pane of the pivot table filters all the data in the table
It is further possible to search for the number of female-gender finishers per Run Number, as follows; shown in the All Runs Analysis screen-clip example below:
- Select the Gender field (highlighted in yellow below).
- Drag the Gender field into the Filters area (shaded in yellow below).
- Select F.

Conclusion
Having familiarised yourself with the Four Parts of a Pivot Table, you may be interested to explore our next Topic in the Fulfil LearnDash LMS menu titled: Pivot Table Interface.